- Many organizations are not investing in developing HR teams’ competencies related to data and metrics, and as a result, HR professionals often lack the training required to become data driven and leverage strategic data to their advantage.
- There is a disconnect between how often organizations report metrics and analytics as a top priority and the investment being made in developing HR’s data-driven competencies.
Need Extra Help?
Speak With An Analyst.
- Get on-demand project support
- Get advice, coaching, and insight at key project milestones
- Go through a Guided Implementation to help you get through your project

Our Advice
Critical Insight
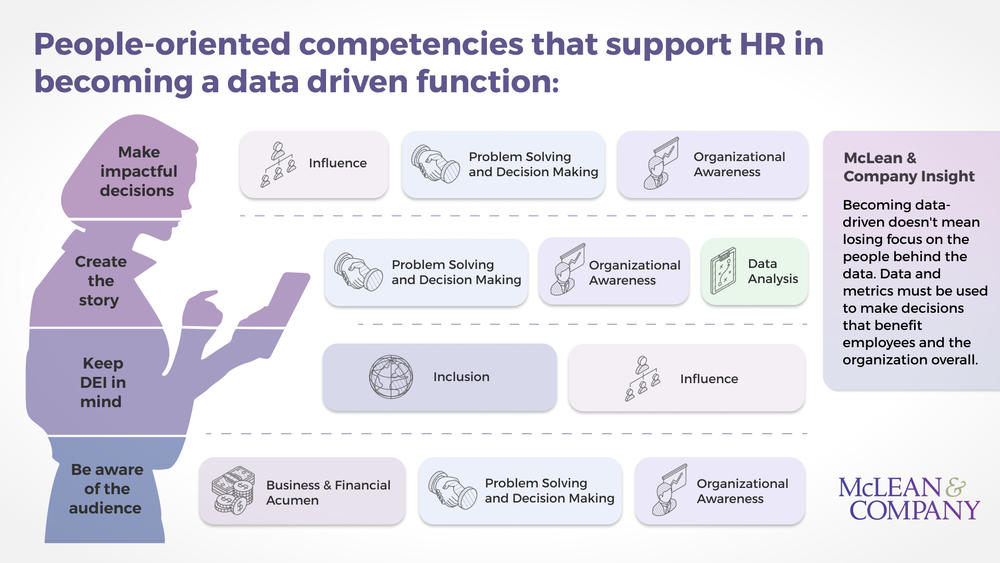
- Becoming data driven doesn’t mean losing focus on the people behind the data. Data and metrics must be used to make decisions that benefit employees and the organization overall.
Impact and Result
- Select metrics that matter to generate insights and provide data-driven recommendations to various audiences across the organization.
- Many organizational leaders find dashboards to be an effective way to present HR data, so create these valuable tools for HR to monitor the current state and provide insights to meet audience needs.
- Keep the audience behind the data top of mind when creating dashboards by telling a story that leads to insights and recommendations and ensuring data and metrics are used to make decisions that benefit employees and the organization.

Data-Driven HR
This program has been approved for continuing professional development (CPD) hours under Section A of the Continuing Professional Development (CPD) Log of the Human Resource Professionals Association (HRPA).
McLean & Company is recognized by SHRM and can award Professional Development Credits (PDCs) for the SHRM-CP® or SHRM-SCP®.
HR Certification Institute's® (HRCI®) official seal confirms that McLean & Company meets the criteria for pre-approved recertification credit(s) for any of HRCI’s eight credentials, including SPHR® and PHR®.
How to complete this course:
Use these videos, along with the Project Blueprint deck above, to gain an understanding of the subject. Start with the Introduction, then move through each of the Course Modules. At the end of each Module, you will be required to complete a short test to demonstrate your understanding. You will complete this course when you have completed all of the course tests.
- Number of Course Modules: 5
- Estimated Completion Time: 1.5 hours
Learning Outcome
Reliable data combined with metrics that matter enables HR to add value to the organization. This course will help you to take stock of your ability to deliver meaningful HR metrics & analytics, focus your resources on what will have the highest impact and address client needs, and make a plan for continuing to improve to become a data-driven HR function.
Learning Objectives
By the end of this course, learners will be able to:
- Define and assess the foundations required for HR metrics and analytics.
- Select and prioritize HR metrics that matter to clients.
- Incorporate best practices into HR dashboard design, including data analysis, insight generation, storytelling, and data visualization.
- Identify strategies to improve HR’s ability to use data to support organizational decision-making.
All of our McLean Academy courses have closed captioning available. To turn this function on, click on the C.C. in the bottom right corner of the video screen and click "English" on the options that pop-up.
Course Modules
Data-Driven HR Introduction: Become a Data-Driven HR Function
Data-Driven HR Module 1: Assess HR metrics and analytics foundation
Data-Driven HR Module 2: Select metrics that matter
Data-Driven HR Module 3: Create a dashboard
Data-Driven HR Module 4: Plan for the future
 Use Dashboards to Become a Data-Driven HR Function
 Get Started With HR Analytics
 Establish Data Governance for HR
 Data Literacy for HR Professionals Module 3
 Basics of Navigating Data for Managers
 Develop an Effective Talent Retention Plan